Insights
The Insights page shows how your applications are using Bucketeer. Use it to track your monthly usage, confirm that your SDKs are connecting as expected, and investigate latency or errors when an integration misbehaves.
To open it, select Insights from the sidebar menu. The page is divided into two sections: Monthly Usage, which reports long-term consumption, and a set of time series charts, which report real-time performance.
Filtering the data
The filters at the top of the page apply to every chart on the page:
- Project: limit the data to a single project, or select All Projects.
- Environment: limit the data to a single environment, or select All Environments.
- SDK: limit the data to a single SDK, such as Android, iOS, Web, Go Server, or one of the OpenFeature providers. Only SDKs that have sent data appear in this list, which makes it a quick way to confirm which SDKs are actually reporting.
The time series charts have two additional filters:
- API: limit the data to a single server API, such as
GetEvaluations,RegisterEvents,GetFeatureFlags,GetSegmentUsers,GetEvaluation, orSdkGetVariation. - Time range: choose one of the presets (last 1 hour, last 6 hours, last 24 hours, last 7 days, last 30 days, or this month), or select Custom Range to pick your own start and end dates.
A custom range can't exceed 31 days. For longer periods, use the Monthly Usage section, which covers the last 12 months.
Monthly usage
The Monthly Usage section reports the last 12 months of consumption with two charts. Click Export CSV to download the data of both charts, which is useful for internal reporting or capacity planning. Each chart also shows the current month's total under Current Month, with its change compared to the previous month.
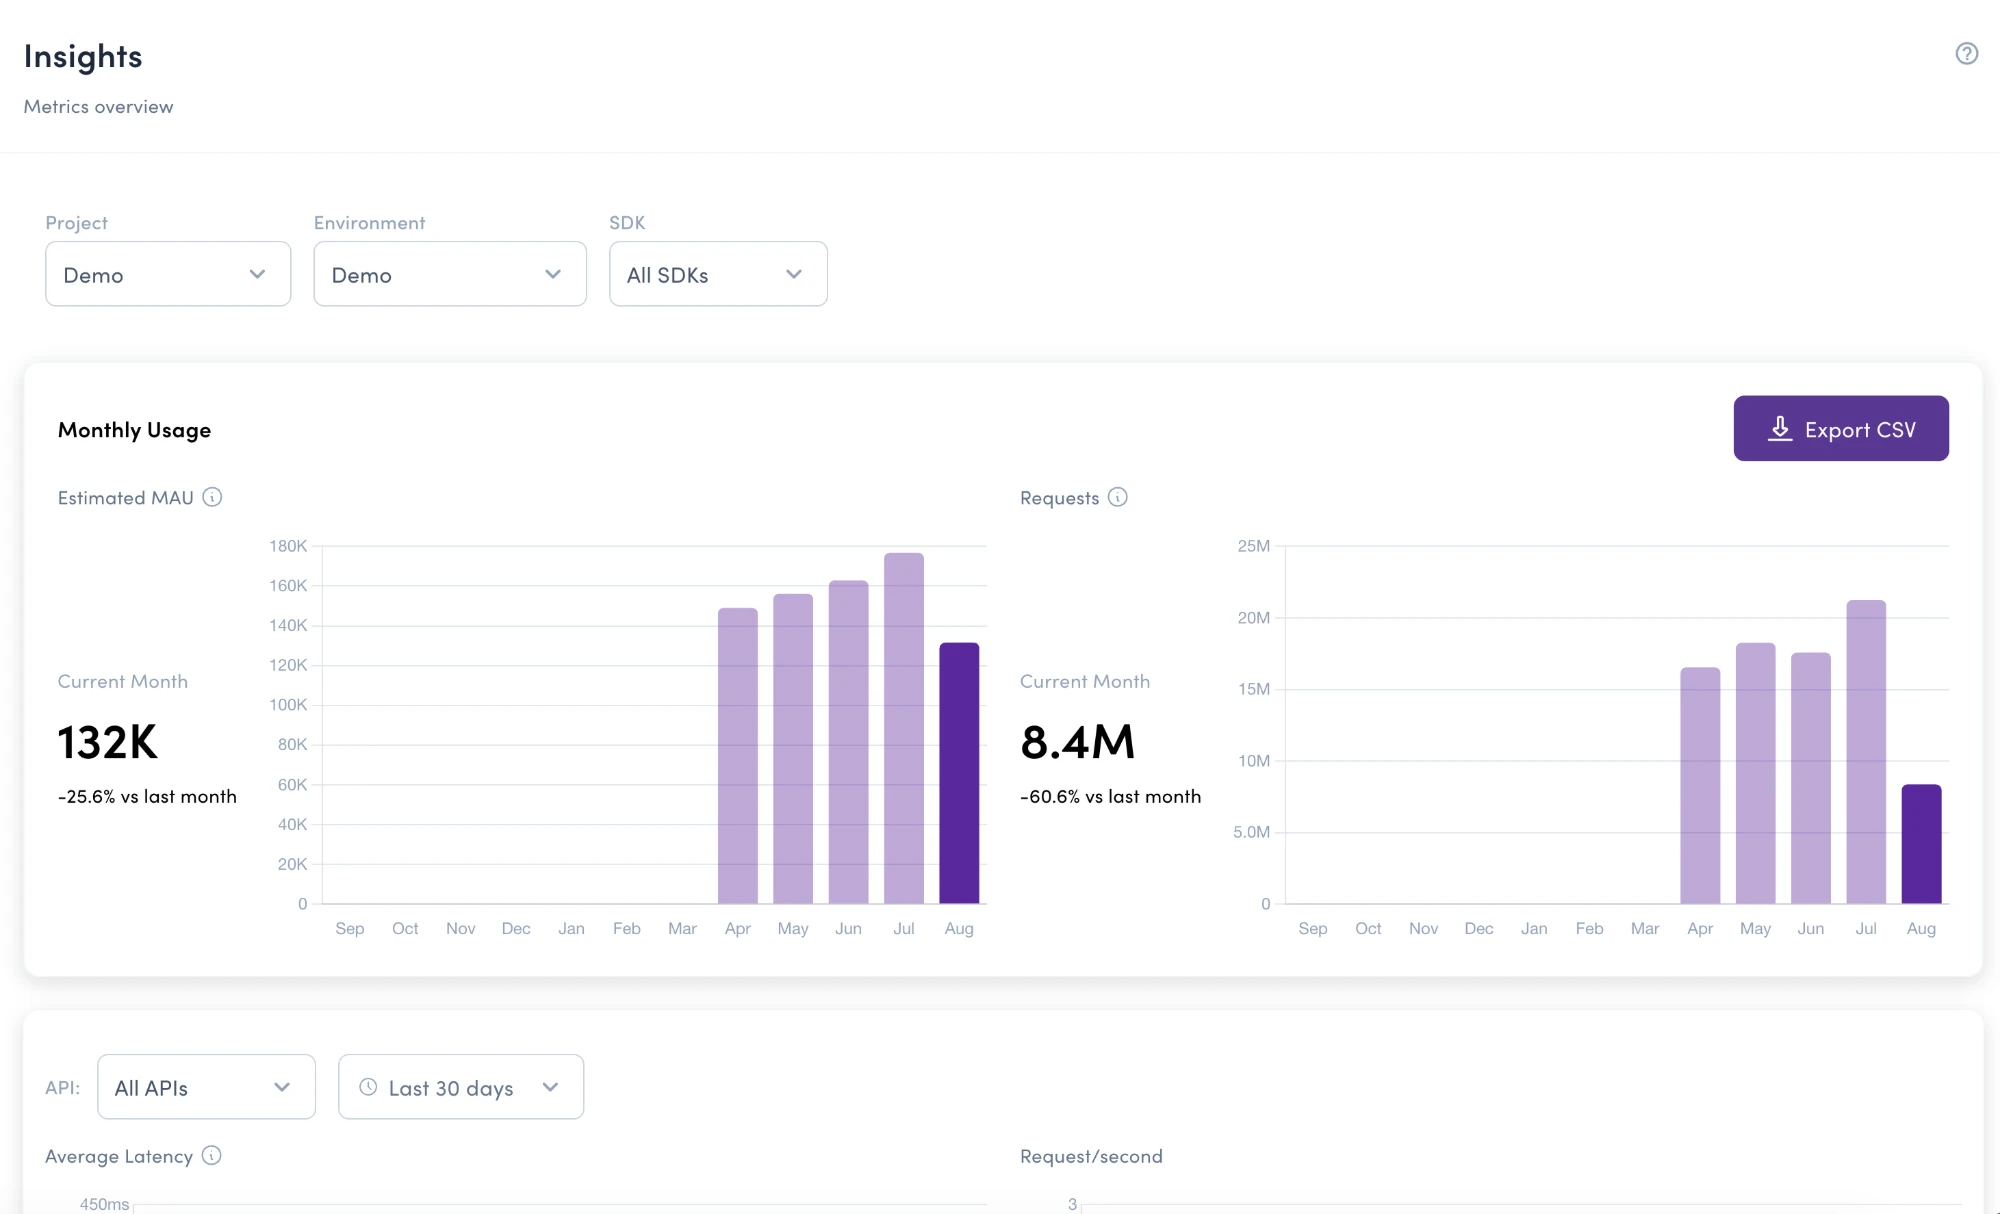
The current month's bar counts only the days aggregated so far, so early in the month it's expected to sit below the previous month and show a negative change. This is most visible on the Requests chart, because requests accumulate over the whole month.
Estimated MAU
The estimated number of unique users who sent requests to Bucketeer. Because this counts unique end users rather than requests, it's the metric to watch if your plan or capacity planning is based on active users.
Keep the following in mind when reading the MAU chart:
- The first month may be slightly inaccurate, because it depends on when data collection started.
- Today's data is not included. Values are aggregated up to the previous day.
- Counting is based on the UTC timezone.
- The value is an estimate and may vary by around 0.81% due to the counting algorithm.
Requests
The total number of API requests from your SDKs that Bucketeer processed. As with MAU, the first month may be slightly inaccurate, today's data is not included, and counting is based on UTC.
Time series charts
These four charts show real-time behavior over the selected time range.
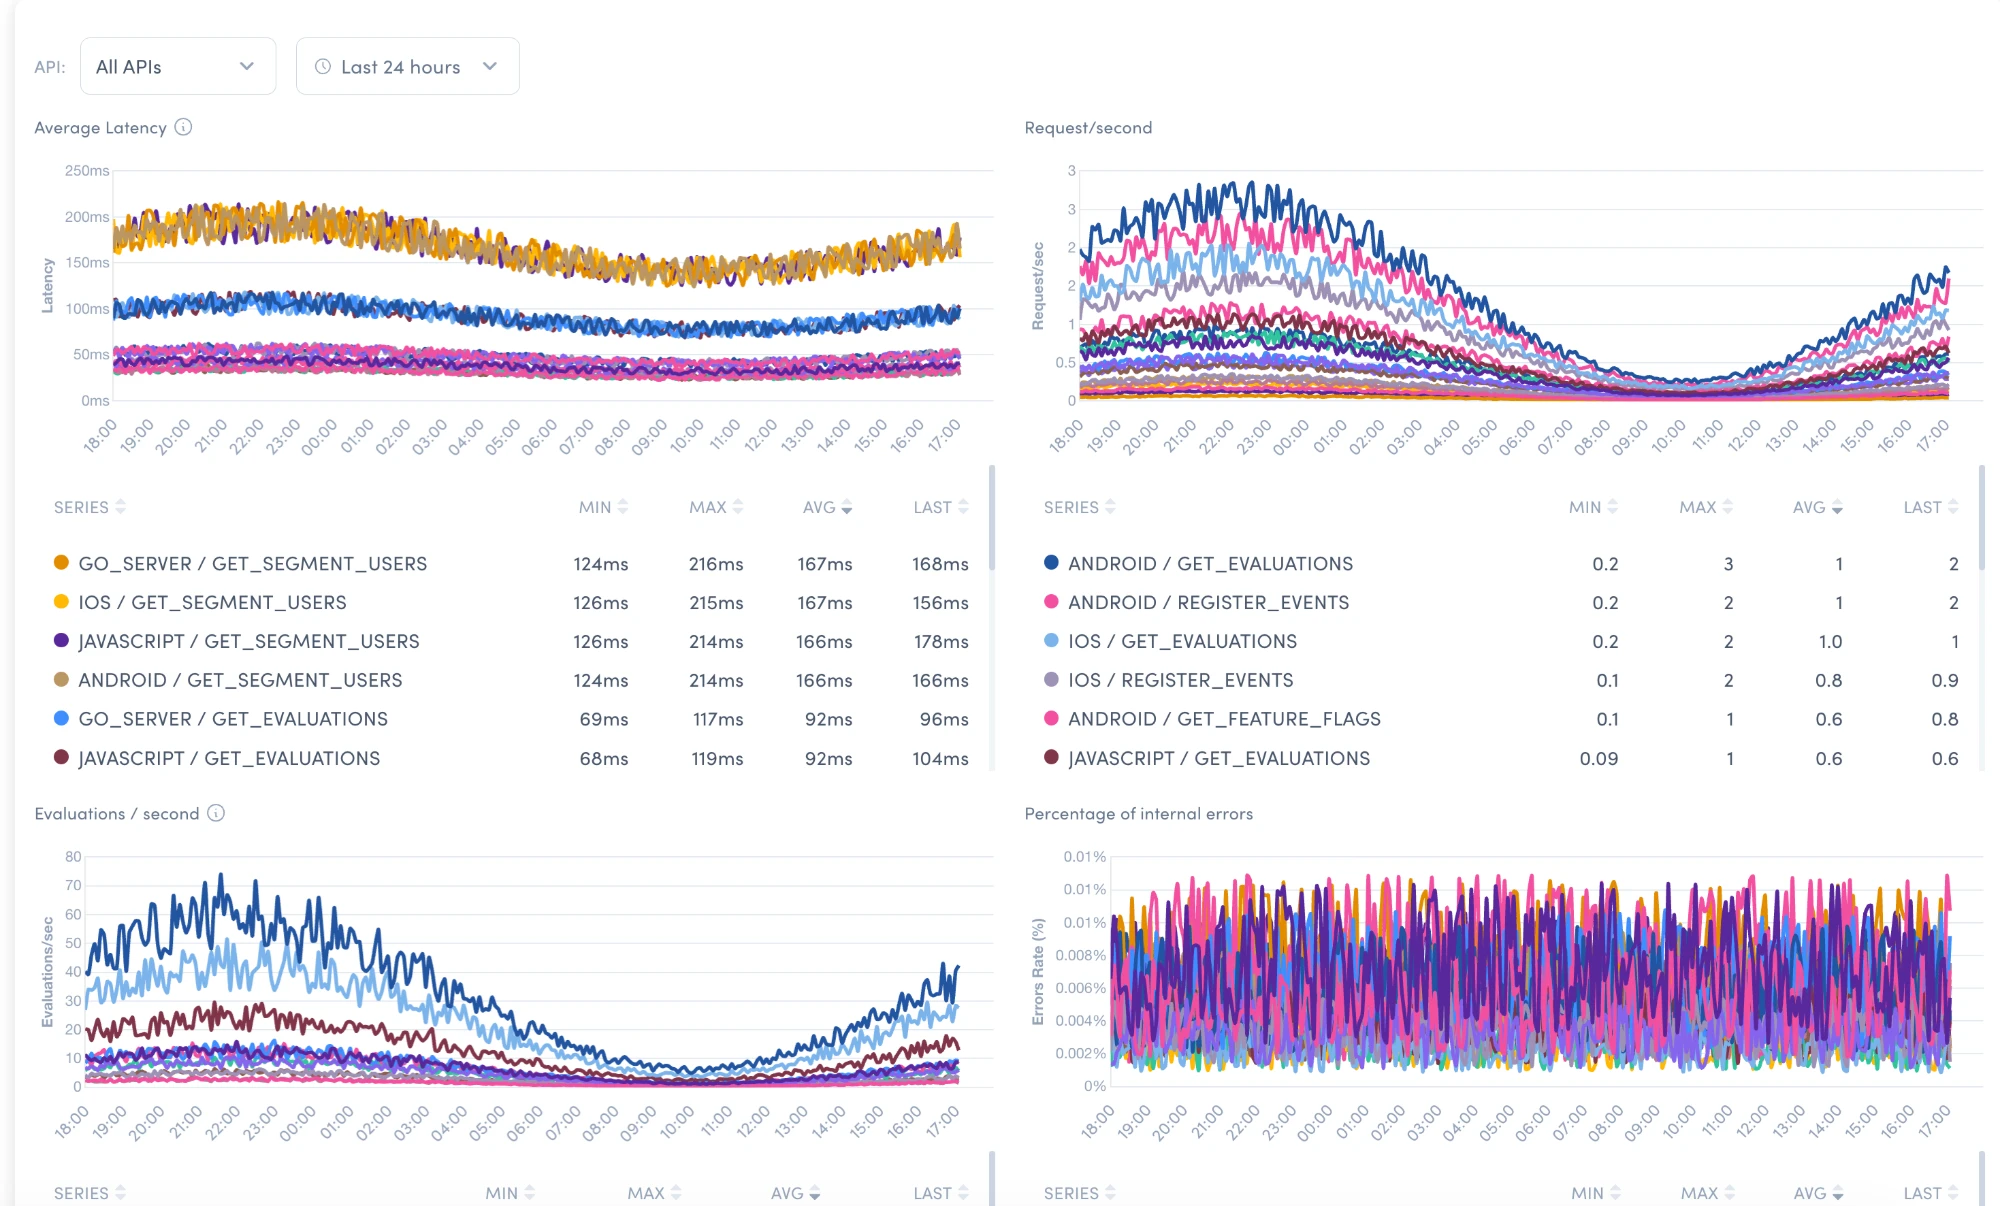
Below each chart, a legend table lists every series with its min, max, avg, and last value. Click any column header to sort, which is the quickest way to find the slowest API or the noisiest SDK. Series are named after the SDK and the API they cover, such as ANDROID / GET_EVALUATIONS.
Average latency
The time from receiving a request from the SDK to returning a response. Use it to confirm that your users are getting fast responses, and to determine whether a slow experience in your application comes from Bucketeer or from elsewhere.
Request/second
The rate of requests your SDKs are sending, split by SDK and API. A sudden drop can indicate that an SDK stopped reporting, and a sudden spike can indicate a misconfigured polling interval.
Evaluations / second
The rate of feature flag evaluations, broken down by evaluation type:
- diff: differential evaluation, which returns only the changes since the last evaluation.
- none: no change since the last evaluation.
- all: returns all evaluations and renews the whole SDK cache.
Most requests from a healthy integration are none or diff, because the SDK only needs the changes. A high proportion of all evaluations means SDK caches are being renewed often, which increases both latency and request volume.
Percentage of internal errors
The percentage of requests that failed with an internal error. Use this chart to confirm whether the errors your application is seeing come from the Bucketeer server.
Insights reports usage across your project and environment. To check which variation a specific end user receives, use the Debugger. To review how a flag has been evaluated over time, check the flag's Evaluations tab.