Debugger
The Debugger is a powerful tool that helps developers verify what variation will be assigned to specific users under different conditions in real-time. It enables you to test and troubleshoot your feature flags quickly and efficiently without affecting your production environment.
Use case
The Debugger is essential when you need to:
- Verify that your targeting rules are working correctly before rolling out to production
- Troubleshoot why a specific user is receiving an unexpected variation
- Test multiple flags simultaneously across different users
- Validate how user attributes affect flag evaluations
- Debug complex targeting scenarios with multiple conditions
For example, you can use the Debugger to test whether your QA team members with specific attributes (like app_version: 1.0.0) will receive the correct variation for new features before releasing them to production.
Using the Debugger
To access the Debugger, navigate to the Debugger page from the sidebar menu under the Management section.
You can also access the Debugger directly from a flag's Targeting tab for quick testing while configuring targeting rules. See the Quick Access from Targeting Tab section below.
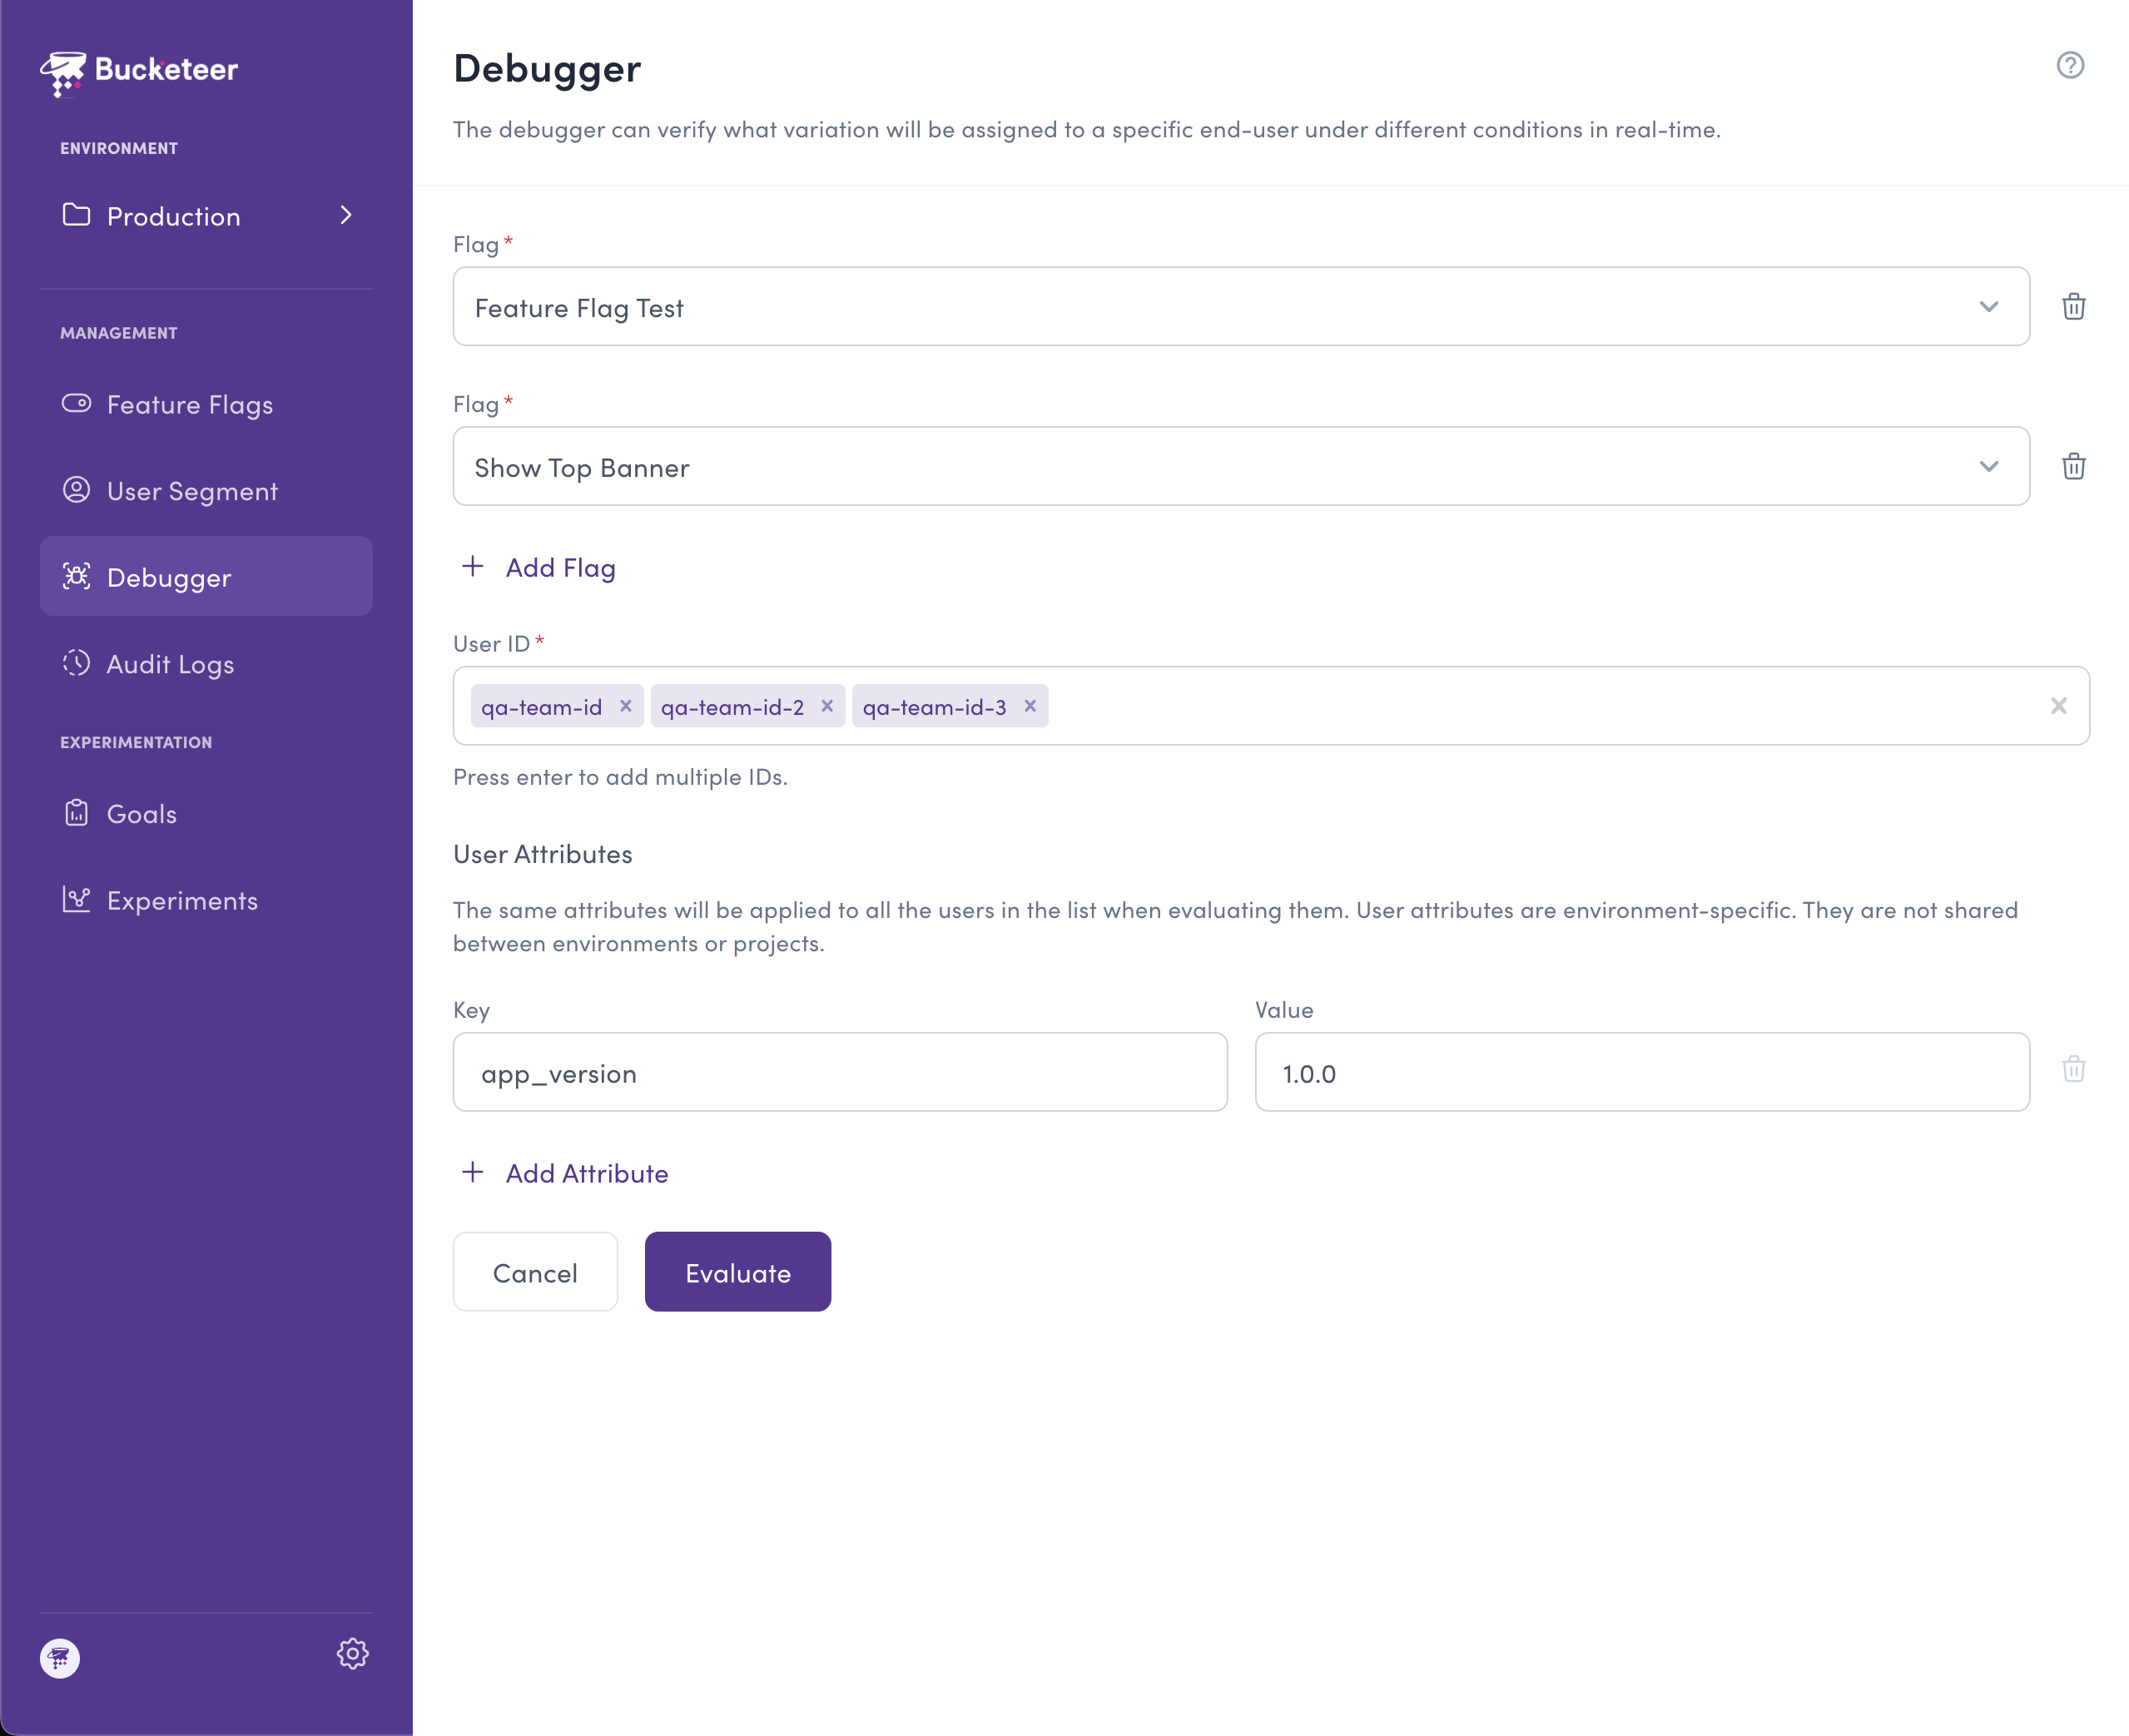
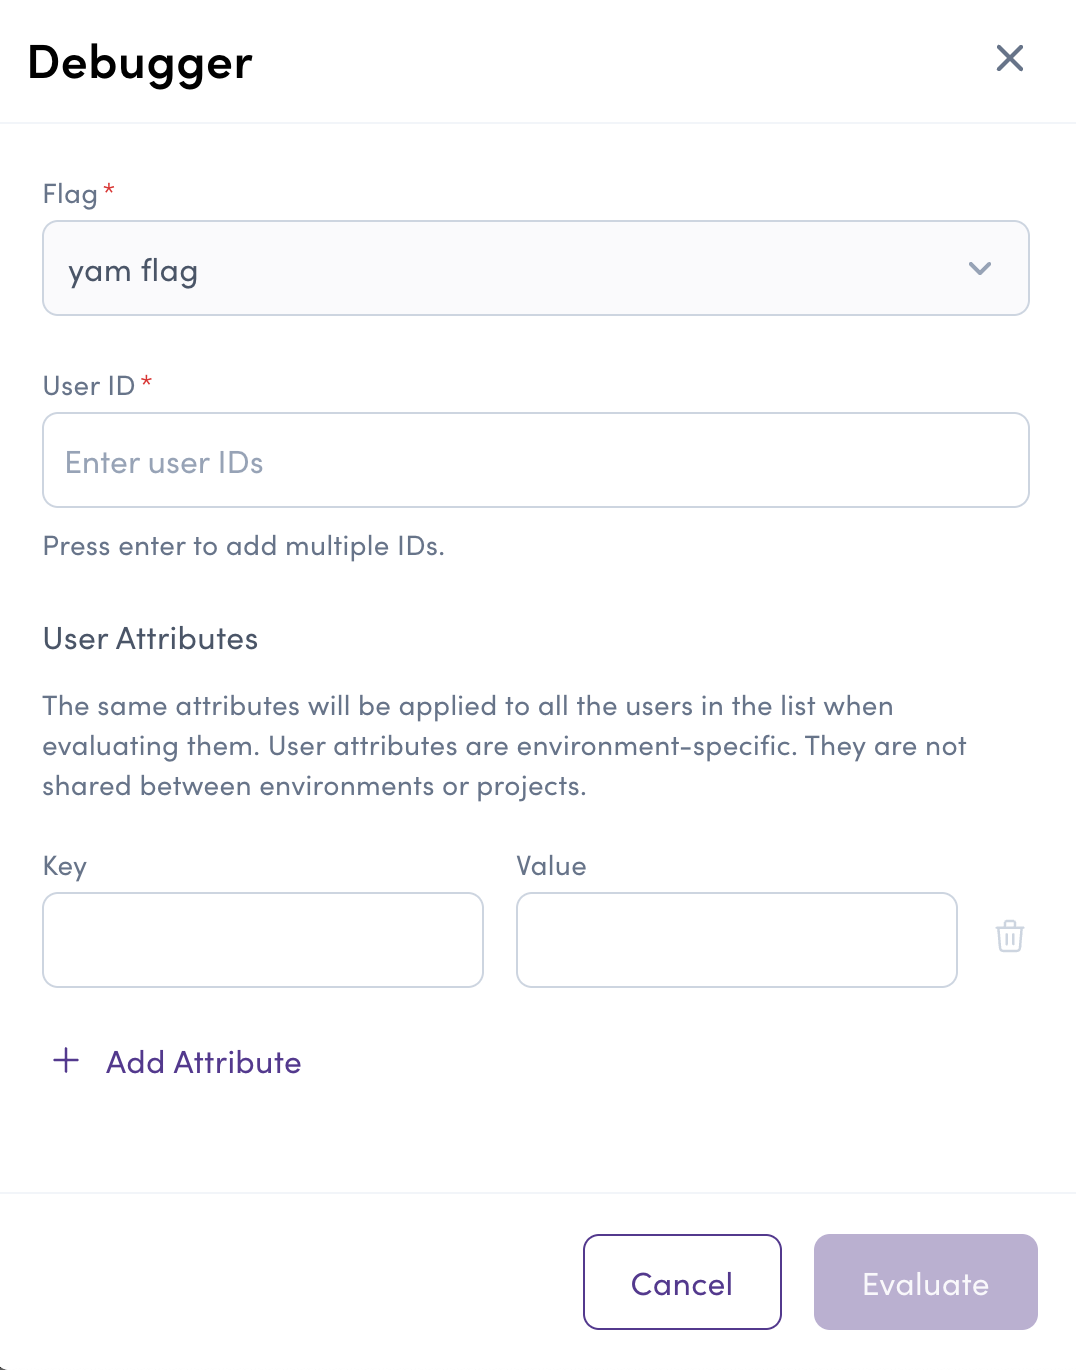
Configuring your test
The Debugger allows you to configure the following parameters:
Flags
Select one or multiple feature flags you want to test. You can add multiple flags by:
- Selecting a flag from the dropdown menu
- Clicking + Add Flag to test additional flags simultaneously
This is particularly useful when you need to verify how multiple flags work together or test the behavior of dependent flags.
User IDs
Enter one or multiple user IDs to test against your selected flags. You can:
- Add multiple user IDs by pressing Enter after each ID
- Test the same flags against different users to verify consistent behavior
- Include user IDs from different segments or user groups
The user IDs you enter should match the format used when initializing the Bucketeer SDK in your application.
User Attributes
Define key-value pairs for user attributes that will be applied to all users in your test. User attributes are:
- SDK-compatible: The same attributes you define in your client SDK
- Evaluation criteria: Used by your feature flags to determine which variation to serve
Common examples include:
app_version: The version of your applicationuser_type: Premium, free, trial, etc.region: Geographic locationplatform: iOS, Android, web, etc.
You can add multiple attributes by clicking + Add Attribute.
The attributes you set in the Debugger will be applied to all users in the test when evaluating them. This allows you to simulate how users with specific characteristics will be targeted by your flags.
Running the evaluation
Once you've configured your flags, user IDs, and attributes, click the Evaluate button to run the test. The Debugger will show you the results in real-time, indicating which variation each user will receive for each flag.
Editing your configuration
After running an evaluation, you can modify your test configuration without clearing everything:
- Click the Edit Fields button at the top of the results section
- Update your flags, user IDs, or attributes as needed
- Click Evaluate again to see the updated results
This allows you to iteratively test different scenarios without having to re-enter all your information from scratch.
Viewing results
The Debugger provides two different ways to view your results, making it easy to analyze flag behavior from different perspectives:
Group by User
When grouped by user, the results show all flag evaluations for each individual user. This view is ideal when you want to:
- See all flags a specific user will receive
- Verify a user's complete feature flag experience
- Troubleshoot issues for specific users
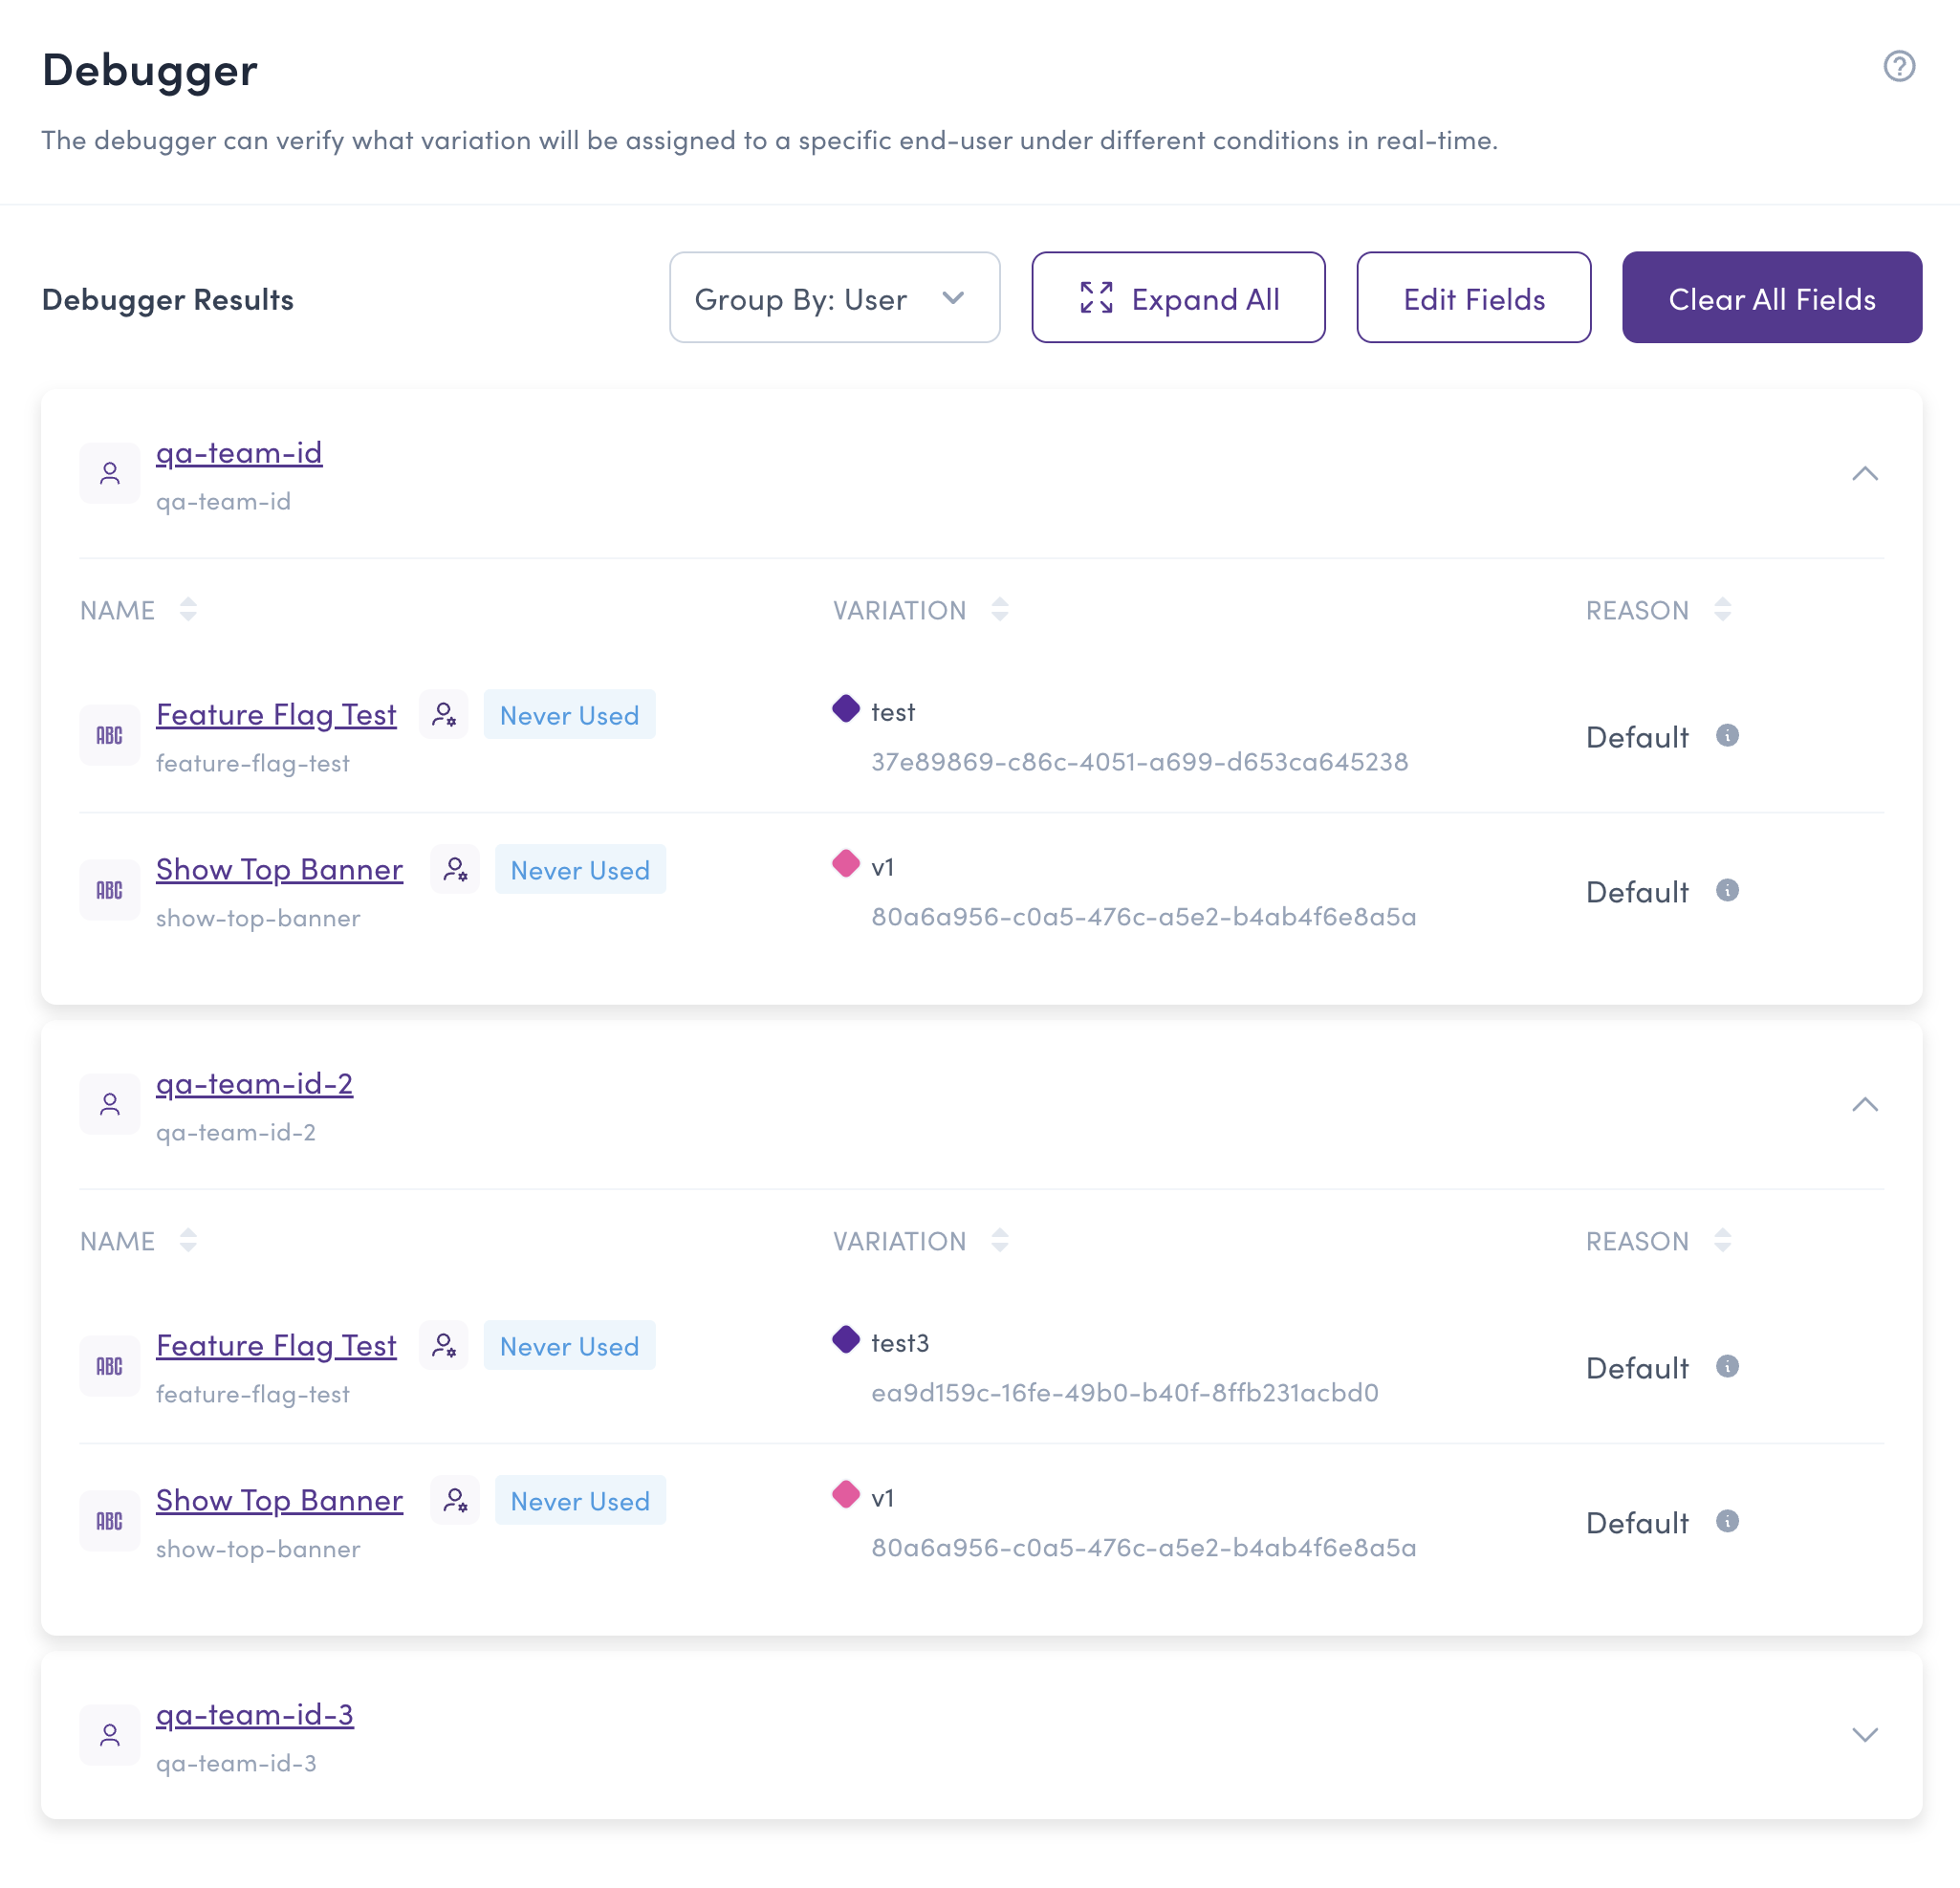
Each user section displays:
- User ID: The identifier for the user
- Flag Name: The feature flags being evaluated
- Variation: The variation assigned to the user
- Variation ID: The unique identifier for the variation
- Reason: Why this variation was assigned (e.g., Default, Target, Rule match)
Group by Flag
When grouped by flag, the results show all user evaluations for each individual flag. This view is useful when you want to:
- See how a specific flag behaves across multiple users
- Verify that targeting rules are working correctly
- Compare variations received by different users for the same flag
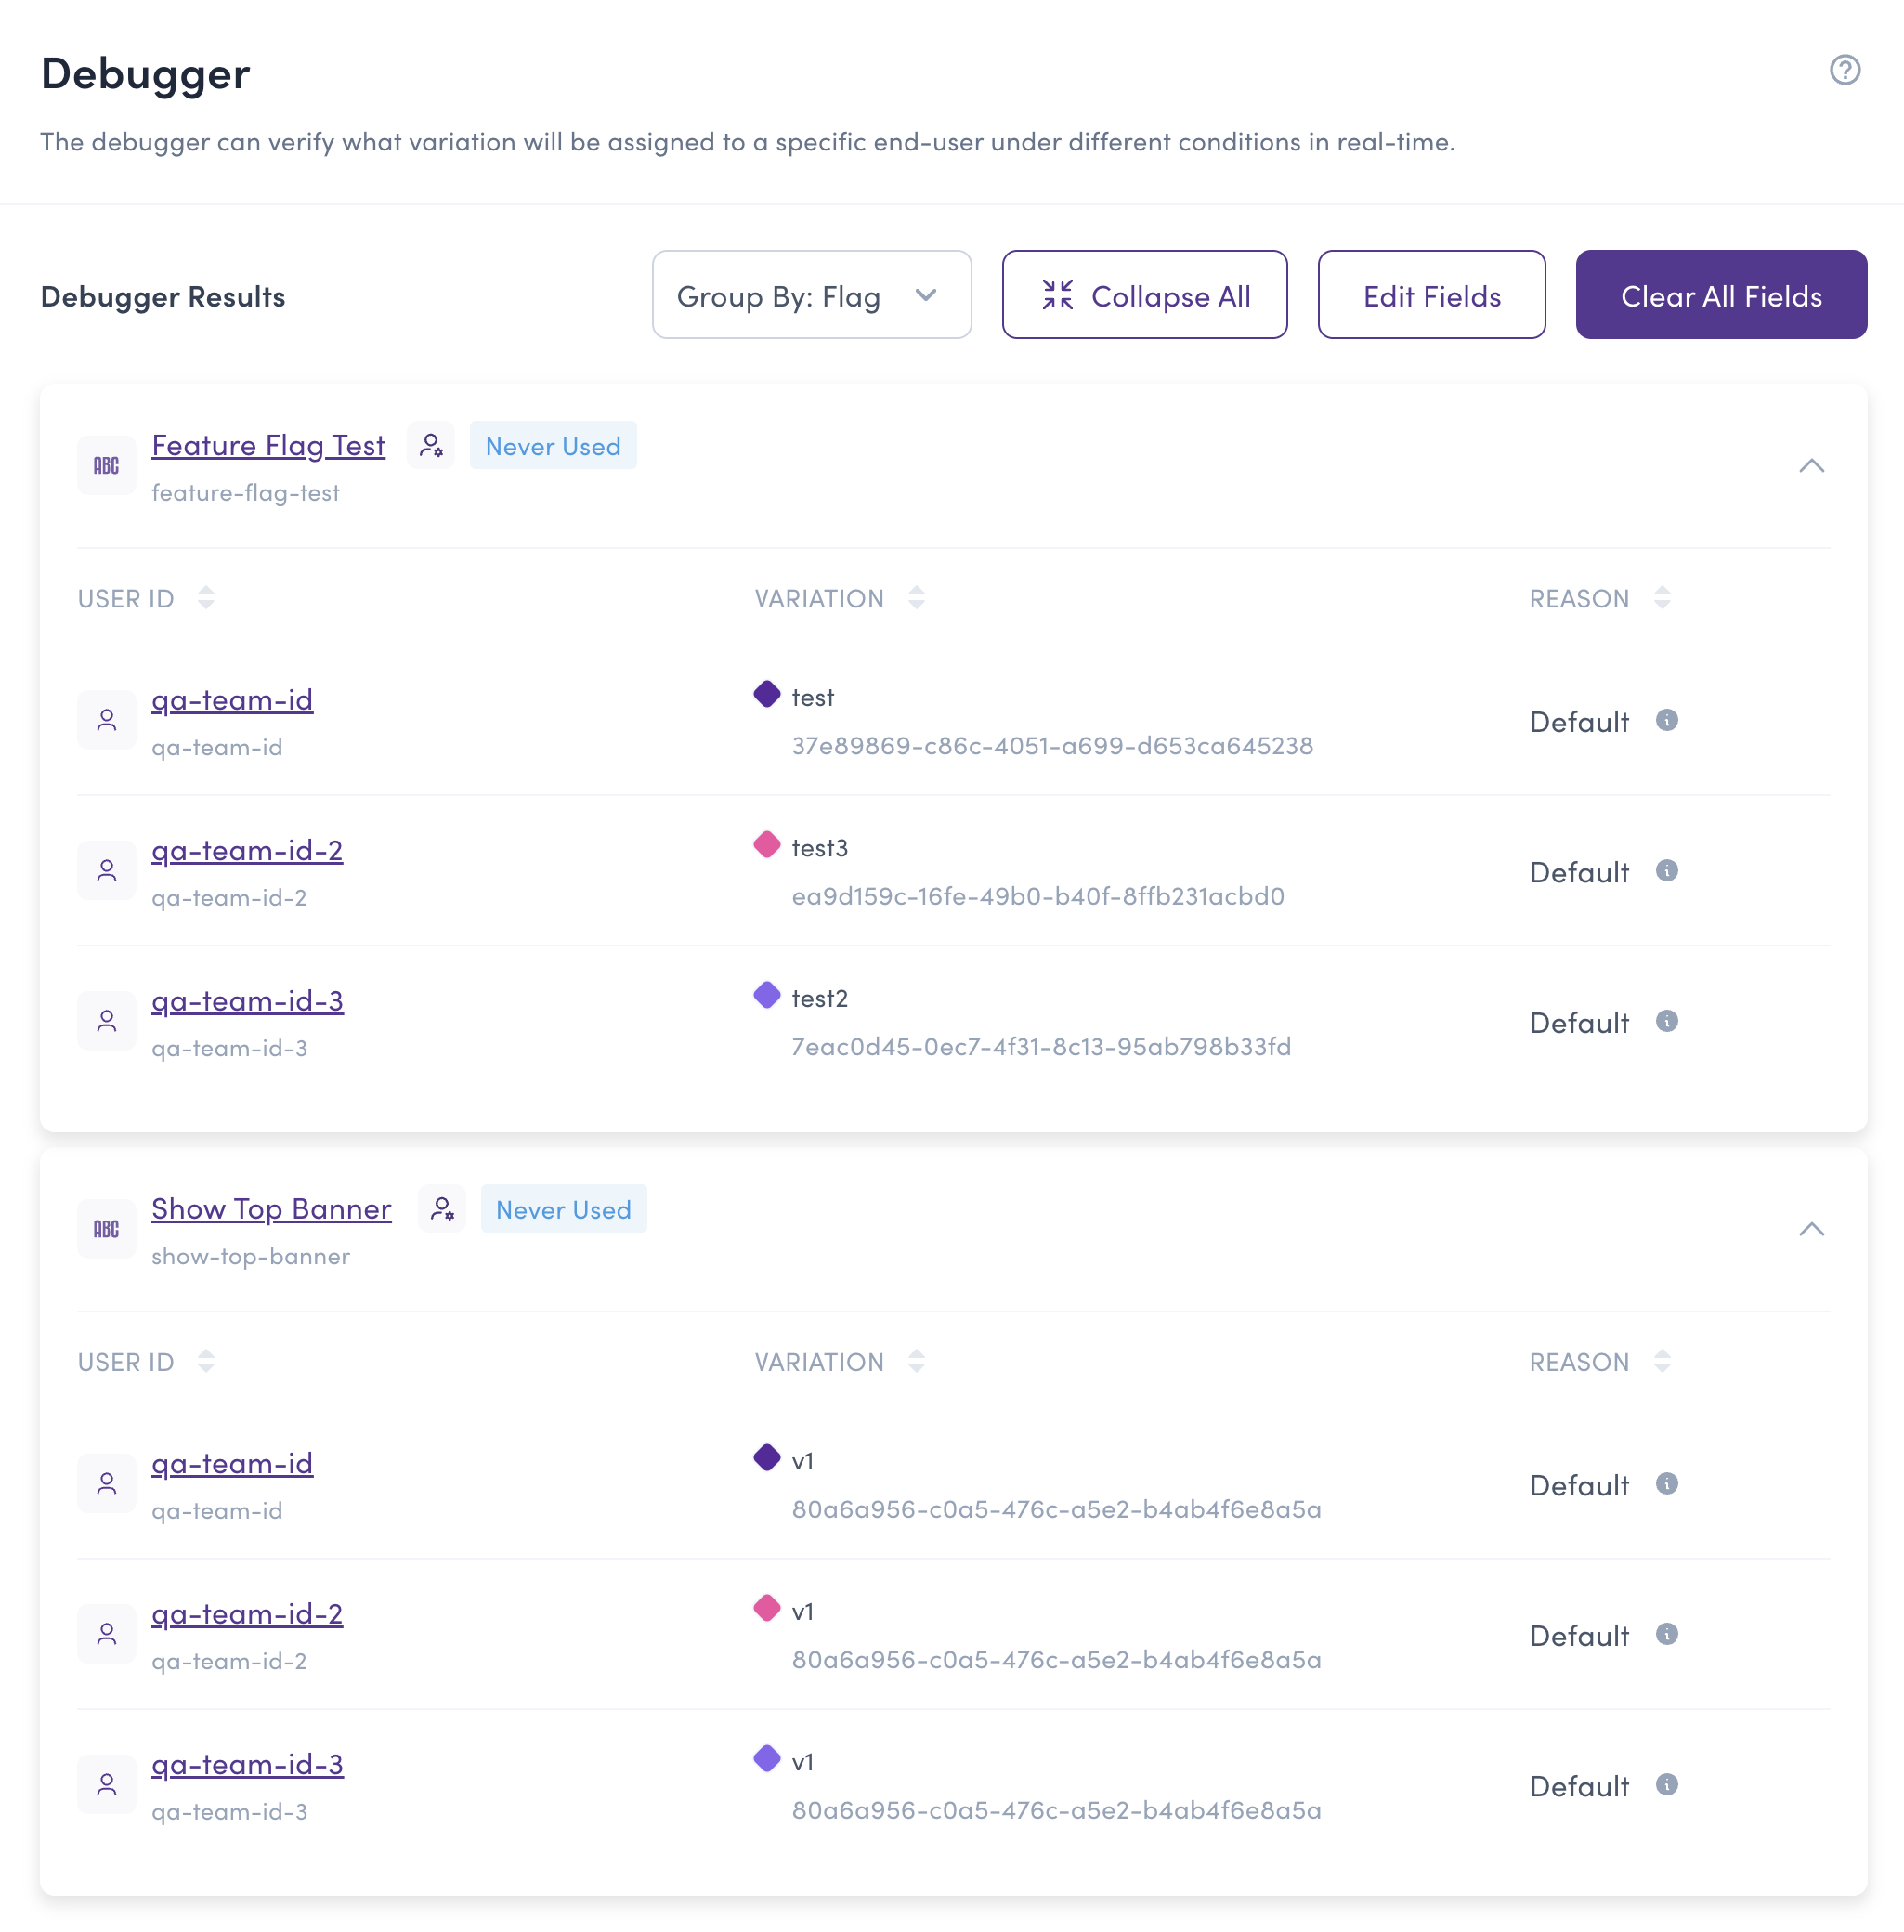
Each flag section displays the same information as the user view, but organized by flag instead of by user.
You can easily switch between "Group By: User" and "Group By: Flag" using the dropdown menu at the top of the results section. Use the Expand All / Collapse All buttons to manage the visibility of results.
Starting fresh
To start a completely new test with a clean slate, click the Clear All Fields button at the top of the results section. This will reset all your inputs (flags, user IDs, and attributes) and allow you to configure a new evaluation from scratch.
Use Edit Fields when you want to make adjustments to your current configuration, or Clear All Fields when you want to start completely fresh with a new test.
Best practices
When using the Debugger, consider these best practices:
- Test before deploying: Always verify your targeting rules with the Debugger before enabling flags in production
- Use realistic attributes: Enter user attributes that match your actual user base to get accurate results
- Test edge cases: Include user IDs and attributes that represent edge cases in your targeting logic
- Verify multiple scenarios: Test with different combinations of attributes to ensure your flags behave correctly under various conditions
- Document results: Use the Debugger results to document expected flag behavior for your team
Quick Access from Targeting Tab
When working on a specific feature flag, you can quickly access the Debugger directly from the Targeting tab. This is particularly useful when you want to verify your targeting rules while configuring them, without navigating away from the flag details page.
To access the Debugger from the Targeting tab:
- Navigate to your feature flag's details page
- Go to the Targeting tab
- Click the Debugger button (with the bug icon) located at the bottom right, next to the Save with Comment button
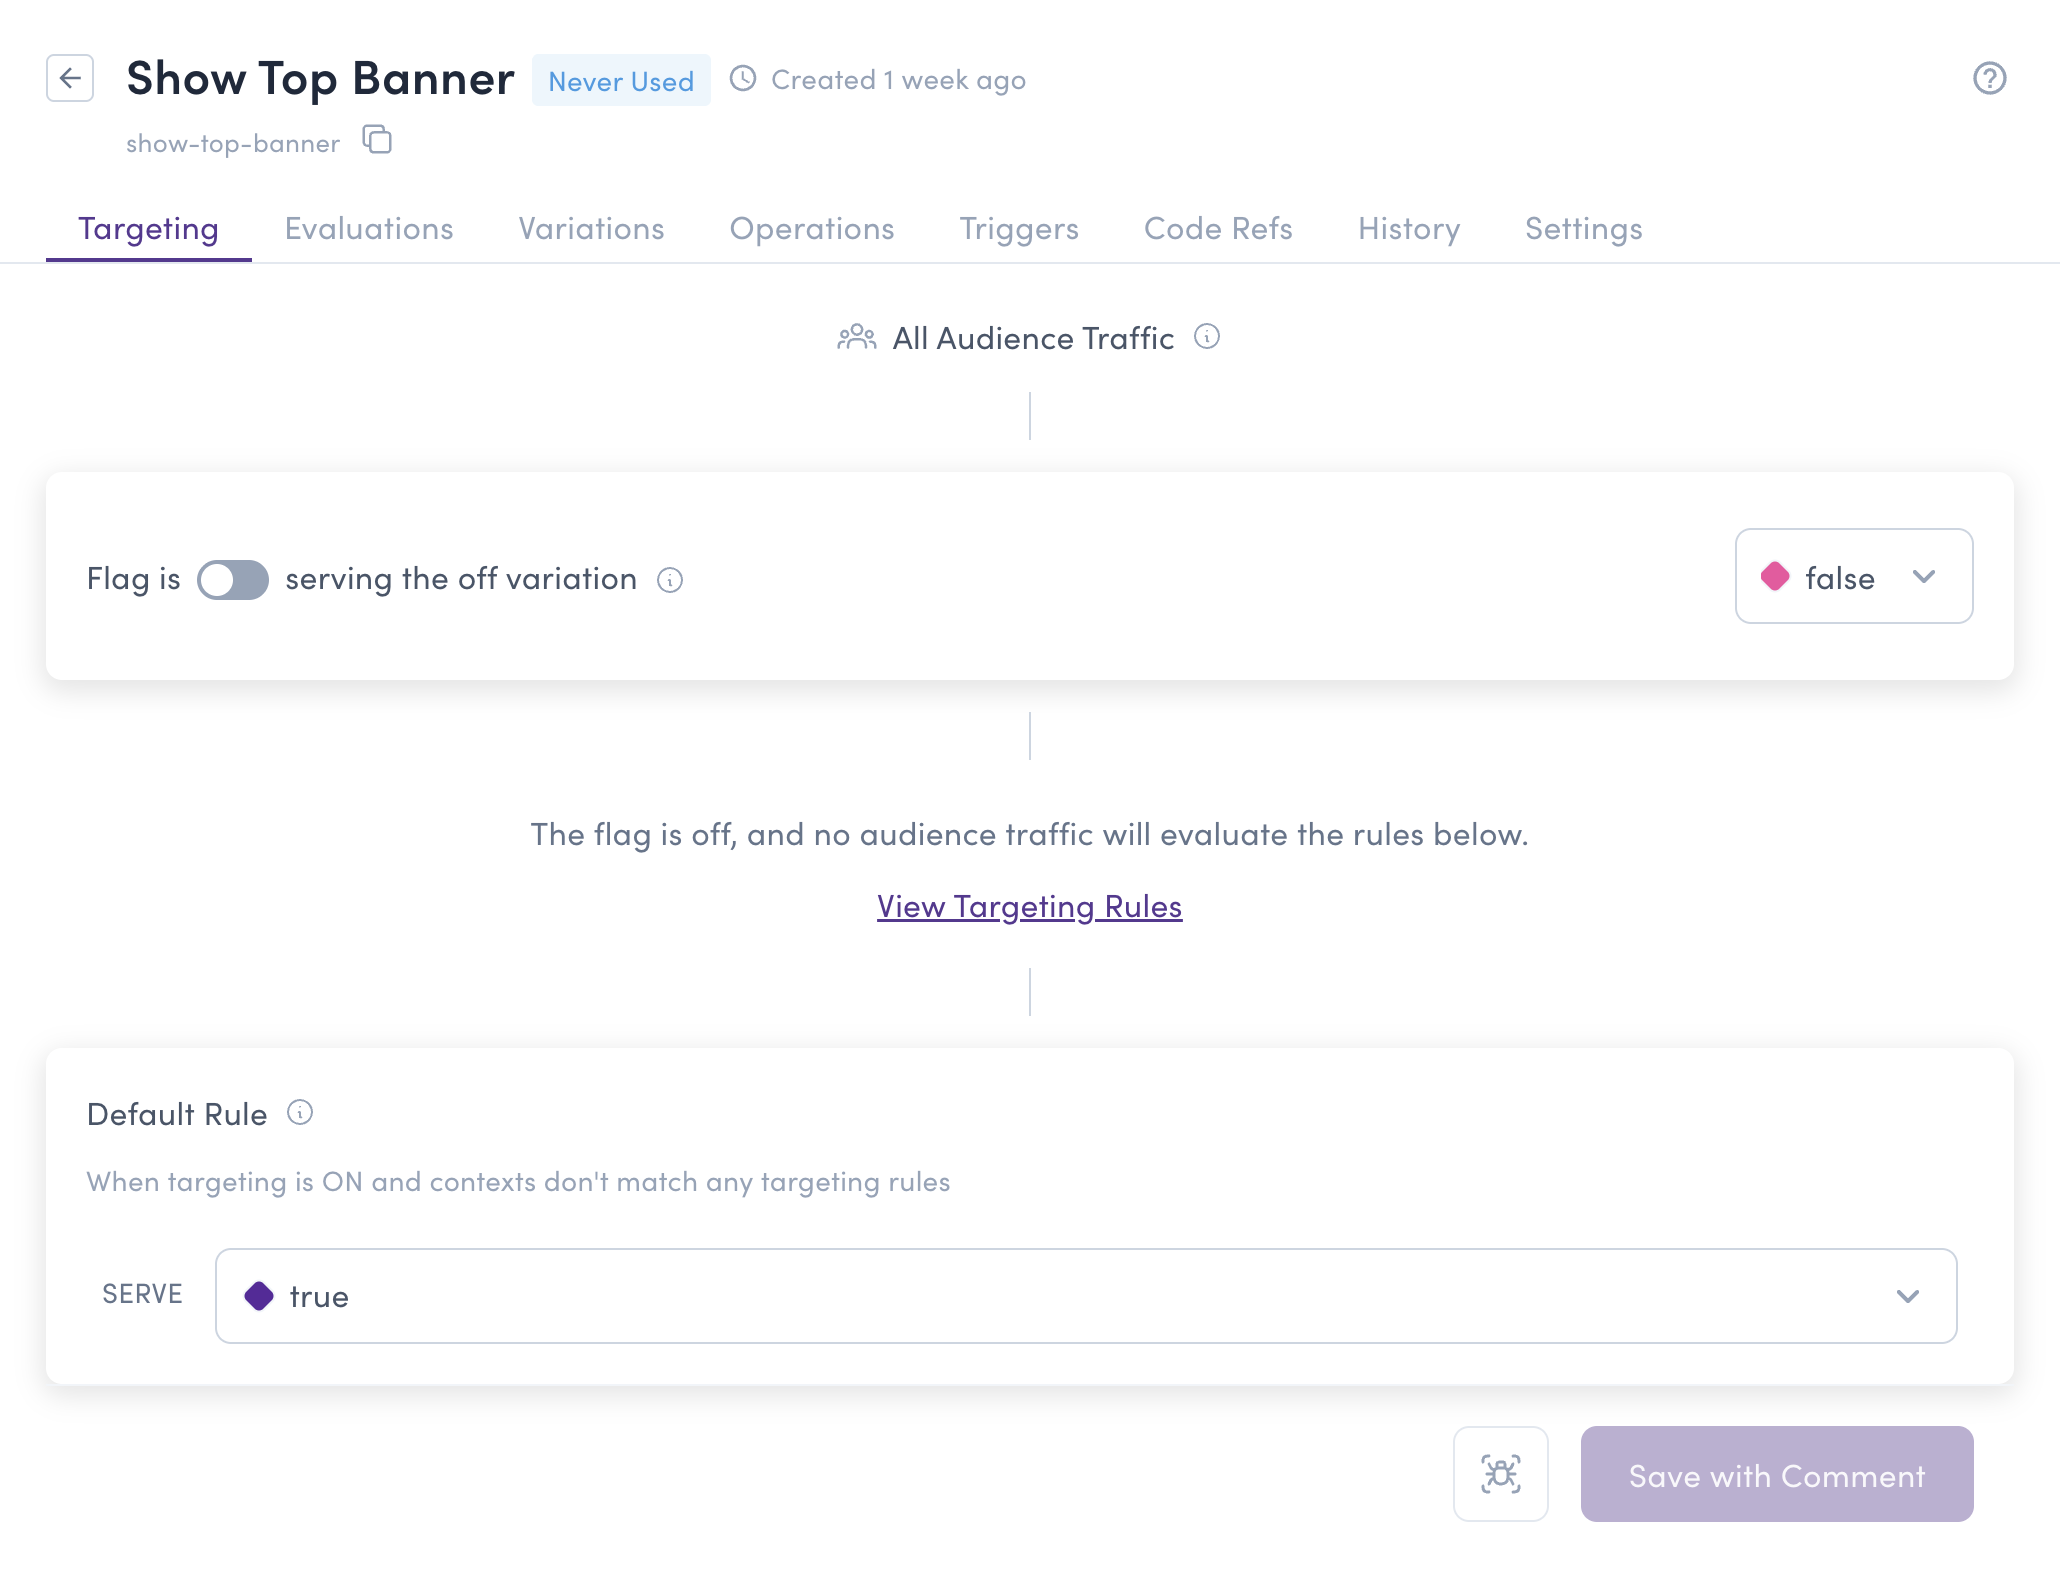
When opened from the Targeting tab, the Debugger will appear as a modal with the current flag already pre-selected, allowing you to immediately test it without having to search for the flag.
This workflow is ideal for:
- Iterative testing: Test your targeting changes as you configure them
- Immediate feedback: Verify rules work correctly before saving
- Focused debugging: Quickly troubleshoot a specific flag without context switching
When making changes to targeting rules, use the Debugger button in the Targeting tab to test your changes immediately. Once you've confirmed the rules work as expected, save your changes and the results remain visible for documentation.