Experiment results
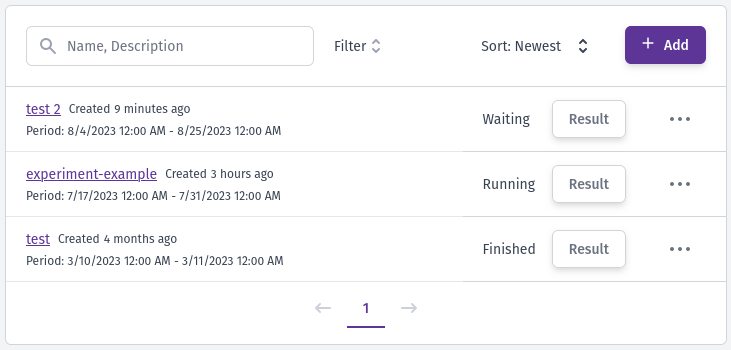
After you create an experiment, it automatically becomes available on the dashboard Experiments tab. Experiments may present one of the following states:
- Waiting: The defined start date still needs to be reached. The experiment result will not present any results.
- Running: The experiment is acquiring data regarding user behavior according to the listed goals. You already have data on the experiment result page.
- Finished: The experiment has reached its end date and has been successfully completed. You can find the final results on the result page.
Independent of the experiment status, you can always access their results by clicking the Result button. The below image presents an example of a list of experiments.
When you access the flag details you also can check experiment results by selecting the Experiment tab.
Analise the experiment results
When you navigate to the experiment result page, you will immediately find information about the experiment's current state and evaluation period at the top. For instance, the example below showcases a Stopped experiment.

Following the experiment status, you will encounter the following components:
- Goal selector: This feature allows you to choose from all the goals associated with the experiment.
- Variation data table: A comprehensive table displays data for all variations within the selected goal. This table presents relevant metrics and insights regarding the performance of each variation, allowing you to compare and evaluate their effectiveness.
- Variation data history chart: It provides the historical data visualization for the selected goal and its associated variations. This graph showcases the performance trends and patterns over time, enabling you to observe data changes. The chart can present data related to all the columns available in the table.
An example dataset from an experiment is shown in the image below, considering Goal-1 as the focus. The graph showcases the Conversion Rate data for all four existing variations, allowing you to assess and compare their performance.
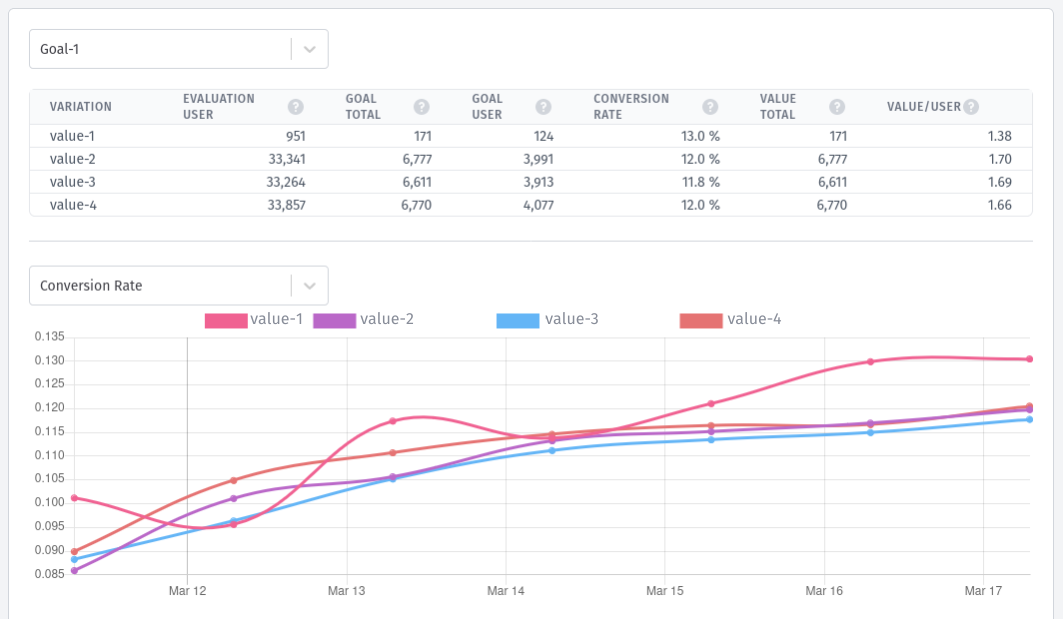
Table data
The variation data table in the experiment results provides valuable information for analysis. It includes the following columns:
- Evaluation user: This column represents the number of unique users who received the variation from the server after an SDK request. It indicates the actual count of users who were assigned to a specific feature flag variation.
- Goal total: Displays the total number of goal events fired by the client. It accounts for all occurrences of the goal event, including multiple triggers by the same user.
- Goal user: Indicates the number of unique users who fired the goal event. Unlike the goal total, this count does not increase when the same user triggers the goal event multiple times. It represents the distinct count of users who achieved the goal.
- Conversion rate: The conversion rate column is calculated by dividing the number of unique users who fired the goal event by the number of unique users for whom a variation was returned. It provides insights into the percentage of users who successfully completed the goal based on the assigned variation.
- Value total: The value total column represents the total number of values assigned to a goal event. This column may have different values for each variation. For example, it can measure how much a user spends based on each variation. In cases where the goal is to check if the user performed a desired task (e.g., clicking a button), this column may contain only nullable values.
- Value/User: The value/user column calculates the average values assigned to the goal event per user. It is calculated as the sum of the numbers assigned to the goal event divided by the number of unique users who fired the goal event.
Best variation based on the Bayesian inference
At the bottom of the screen, the Bucketeer system provides suggestions regarding the best-performing variation in the experiment. To determine the best variation, Bucketeer leverages Bayesian inference. This approach allows for making predictions about the top-performing variation without requiring an in-depth understanding of data science.
Using Bayesian inference enables Bucketeer to update the probability of selecting the best variation as new data is acquired. It compares the performance of each variation to a baseline, typically a control group or reference point established when creating the experiment.
In the experiment results, you will find additional information in the existing table that aids in the selection of the best-performing variation:
- Improvement: This metric quantifies the improvement achieved by each variation compared to the baseline. It is calculated by comparing the range of values observed for a variation with the range of values observed for the baseline. A higher improvement value indicates a more favorable performance compared to the baseline.
- Probability to beat baseline: This estimated likelihood represents the probability of a variation surpassing the performance of the baseline. It helps gauge the potential for a variation to outperform the baseline. It provides insights into the relative effectiveness of each variation.
- Probability to be best: This metric indicates the probability of a variation being the top-performing option. It represents the possibility of a variation outperforming all other variations and being presumed as the most successful one.
The image below illustrates an example of the results obtained through Bayesian inference, continuing from the previous set of results presente previously.
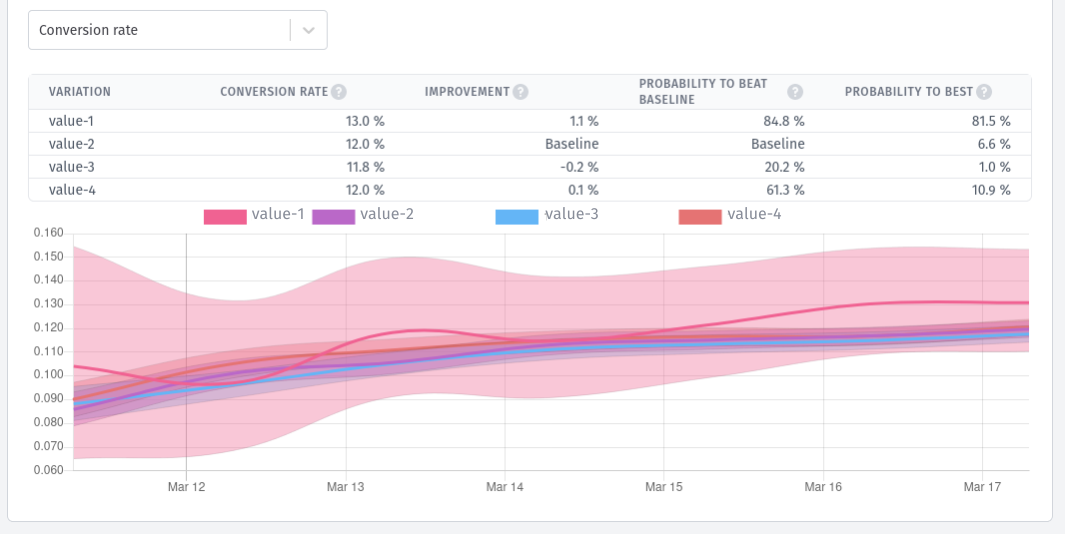
The Bucketeer team suggests selecting the best variation with a minimum 95% confidence level in both probability to beat baseline and probability to be best.
Based on the Bucketeer recommendation, the current test should continue to acquire more data before selecting the best variation. If no variation reaches the recommended confidence value, the test should keep running.